DIY: Monitor Temperature and Humidity with DHT22/AM2302 and Prometheus
Monitoring environmental conditions is a great way to combine IoT with cloud-native observability tools. In this article, we’ll build a simple and reliable setup to monitor temperature and humidity using a Raspberry Pi and a DHT22 (AM2302) sensor.
We’ll walk through:
- how to connect the sensor to the Raspberry Pi
- how to collect sensor data
- and how to expose these readings using a custom Prometheus exporter written in Go
Finally, we’ll visualize the metrics in Grafana with a clean and customizable dashboard. A great DIY project for learning Prometheus exporters, time-series databases, and integrating real-world sensors into your monitoring stack.
Meet the Sensor: AM2302 (DHT22)
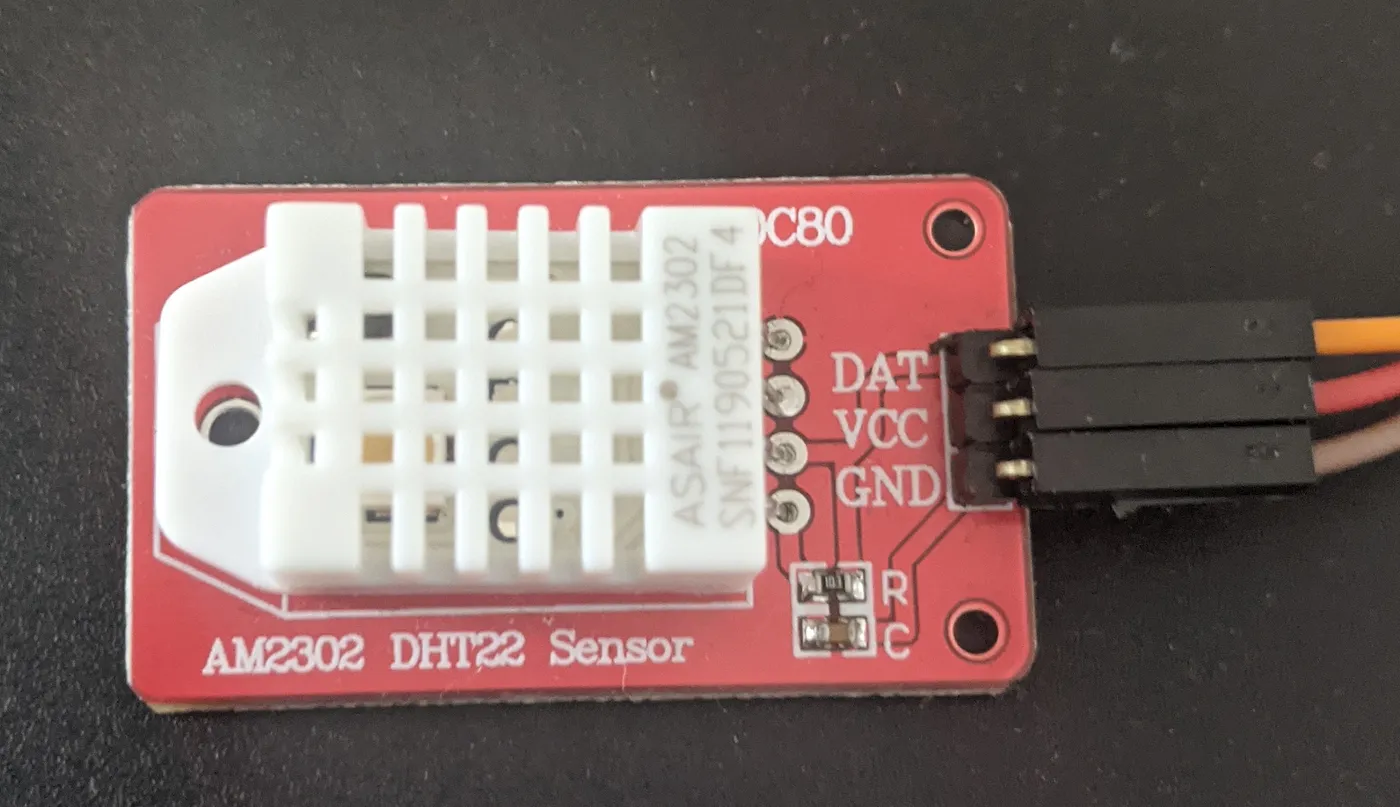
The AM2302 is a wired version of the popular DHT22 sensor. It’s low-cost, easy to use, and perfect for hobbyist. monitoring setups.
Key specs:
- Voltage: 3V to 5V (logic and power)
- Current draw: Max 2.5 mA during measurement
- Humidity range: 0–100% RH (±2–5%)
- Temperature range: -40°C to +80°C (±0.5°C)
- Sampling rate: Max one reading every 2 seconds (0.5 Hz)
- Dimensions: 15.1 mm × 25 mm × 7.7 mm
- Interface: 4-pin header (0.1" spacing)
It’s accurate enough for indoor use and easy to integrate with a Raspberry Pi GPIO.
Wiring the Sensor to the Pi
Wiring the AM2302 is straightforward:
| Sensor Pin | Function | Raspberry Pi Pin |
|---|---|---|
| 1 | VCC (Power) | 3.3V (Pin 1) |
| 2 | Data | GPIO 4 (Pin 7) |
| 3 | Not used | - |
| 4 | GND | Ground (Pin 6) |
Testing the Sensor
Before writing a Prometheus exporter, test the sensor with a basic Python script.
Install dependencies :
$ sudo apt-get update
$ sudo apt-get install python3 python3-pip
$ python3 -m pip install --upgrade pip
$ python3 -m pip install Adafruit-DHT
Here the testing script :
import Adafruit_DHT

sensor = Adafruit_DHT.DHT22
pin = 4

humidity, temperature = Adafruit_DHT.read_retry(sensor, pin)
print(f'Temp: {temperature:.1f}°C, Humidity: {humidity:.1f}%')
Make the script executable and launch it :
$ chmod +x am2302_tester.py
$ python3 am2302_tester.py
Temp=19.2*C  Humidity=55.0%
Alright, everything is working correctly. We can now go ahead with the coding of the prometheus exporter !
Writing a Prometheus Exporter in Go
Configuration
The configuration is a YAML file and has different location following the priority:
/etc/dht-prometheus-exporter.yml$HOME/dht-prometheus-exporter.yml$PWD/dht-prometheus-exporter.yml
The viper package manages the configuration file and stores values into a struct. The recurrent information is accessible to other parts of the project.
package main

import (
	"fmt"
	"github.com/spf13/viper"
)

type Config struct {
	path            string
	name            string
	gpio            string
	maxRetries      int
	listenPort      int
	defaultLogLevel string
	temperatureUnit string
}

func ReadConfig() *Config {
	/**
	Reads YAML configuration file and create a struct containing the values
	**/
	viper.SetConfigName("dht-prometheus-exporter")
	viper.SetConfigType("yaml")
	viper.AddConfigPath("/etc")
	viper.AddConfigPath("$HOME")
	viper.AddConfigPath(".")
	err := viper.ReadInConfig()

	if err != nil {
		panic(fmt.Sprintf("Error when reading config file: %v", err))
	}

	config := &Config{
		path:            viper.ConfigFileUsed(),
		name:            viper.GetString("name"),
		gpio:            fmt.Sprintf("GPIO%d", viper.GetInt("gpio_pin")),
		maxRetries:      viper.GetInt("max_retries"),
		listenPort:      viper.GetInt("listen_port"),
		defaultLogLevel: viper.GetString("log_level"),
		temperatureUnit: viper.GetString("temperature_unit"),
	}

	return config
}
Logging
The logrus package manages the logging and reuses the level defined in the configuration :
package main

import (
	log "github.com/sirupsen/logrus"
	"os"
	"sync"
)

const defaultLogLevel = log.InfoLevel

var (
	once     sync.Once
	instance log.Logger
)

func LogLevel(levelName string) log.Level {
	/**
	Set the log level of logrus following the value supplied in the configuration
	*/
	var logLevel log.Level

	switch levelName {
	case "debug":
		logLevel = log.DebugLevel
	case "info":
		logLevel = log.InfoLevel
	case "warn":
		logLevel = log.WarnLevel
	case "error":
		logLevel = log.ErrorLevel
	case "fatal":
		logLevel = log.FatalLevel
	case "panic":
		logLevel = log.PanicLevel
	default:
		logLevel = defaultLogLevel
	}

	return logLevel
}

func getLogger(config *Config) log.Logger {
	/**
	Singleton to get the same logger instance everywhere
	*/
	once.Do(func() {
		instance = log.Logger{
			Out:   os.Stderr,
			Level: LogLevel(config.defaultLogLevel),
			Formatter: &log.TextFormatter{
				DisableColors: true,
				FullTimestamp: true,
			},
		}
	})

	return instance
}
Sensor
The go-dht package interface with the sensor. It has already a function to read data from the gpio pin.
A struct contains the collected metrics :
package main

import (
	"fmt"
	"github.com/MichaelS11/go-dht"
)

type Sensor struct {
	config            *Config
	temperatureSymbol string
	client            *dht.DHT
}

const CelsiusSymbol = "C"
const FahrenheitSymbol = "F"

func newSensor(config *Config) *Sensor {
	/**
	Sensor constructor
	*/
	var err error
	var client *dht.DHT
	var temperatureSymbol string

	lg.Info("Initializing the DHT22/AM2302 sensor on the host")
	err = dht.HostInit()
	if err != nil {
		lg.Panic("Failed to initialized DHT22/AM2302 sensor on the host: ", err)
	}

	if config.temperatureUnit == "celsius" {
		client, err = dht.NewDHT(config.gpio, dht.Celsius, "")
		temperatureSymbol = CelsiusSymbol
	} else {
		client, err = dht.NewDHT(config.gpio, dht.Fahrenheit, "")
		temperatureSymbol = FahrenheitSymbol
	}

	if err != nil {
		lg.Panic("Failed to create new DHT client: ", err)
	}

	return &Sensor{
		config:            config,
		temperatureSymbol: temperatureSymbol,
		client:            client,
	}
}

func (s *Sensor) readRetry() (humidity float64, temperature float64, err error) {
	/**
	Reads the sensor data with retry
	*/
	humidity, temperature, err = s.client.ReadRetry(s.config.maxRetries)
	if err != nil {
		lg.Error("Cannot retrieve humidity and temperature from the sensor: ", err)
	}
	lg.Info(fmt.Sprintf("Retrieved humidity=%.2f%%, temperature=%.2f°%s from the sensor",
		humidity, temperature, s.temperatureSymbol))
	return humidity, temperature, err
}
Prometheus collector
The Prometheus package provides the collector. It lists the different metrics to collect and expose them. The humidity and temperature metrics are in the same collector. Metrics have labels to give more context :
- dht_name: name of the sensor to be easily identified (in case of multiple sensors)
- hostname
- unit: the temperature unit in Fahrenheit or Celsius
Describe and Collector functions are already implemented in the Prometheus package. We need to redefine them to overload the functions with our metrics:
package main

import (
	"github.com/prometheus/client_golang/prometheus"
	"os"
)

type Collector struct {
	sensor            *Sensor
	temperatureMetric *prometheus.Desc
	humidityMetric    *prometheus.Desc
}

func newCollector(s *Sensor) *Collector {
	lg.Debug("Creating a new prometheus collector for the sensor")
	return &Collector{
		sensor: s,
		temperatureMetric: prometheus.NewDesc("dht_temperature_degree",
			"Temperature degree measured by the sensor",
			[]string{"dht_name", "hostname", "unit"}, nil,
		),
		humidityMetric: prometheus.NewDesc("dht_humidity_percent",
			"Humidity percent measured by the sensor",
			[]string{"dht_name", "hostname"}, nil,
		),
	}
}

func (c *Collector) Describe(ch chan<- *prometheus.Desc) {
	ch <- c.temperatureMetric
	ch <- c.humidityMetric
}

func (c *Collector) Collect(ch chan<- prometheus.Metric) {
	humidity, temperature, _ := c.sensor.readRetry()
	hostname, err := os.Hostname()
	temperatureUnit := c.sensor.config.temperatureUnit
	dhtName := c.sensor.config.name
	if err != nil {
		lg.Error("Failed to get hostname")
	}
	ch <- prometheus.MustNewConstMetric(c.temperatureMetric, prometheus.CounterValue, temperature, dhtName, hostname, temperatureUnit)
	ch <- prometheus.MustNewConstMetric(c.humidityMetric, prometheus.CounterValue, humidity, dhtName, hostname)
}
Main file
The main file makes the glue between the previous file’s functions. It created the client charged of reading data from the gpio pin. Then it instantiates the collector with this client and registered it.
Finally, it configures the promhttp server with the logging and starts it. The metrics are accessible on the /metrics
path:
package main

import (
	"fmt"
	"github.com/coreos/go-systemd/daemon"
	"github.com/prometheus/client_golang/prometheus"
	"github.com/prometheus/client_golang/prometheus/promhttp"
	log "github.com/sirupsen/logrus"
	stdlibLog "log"
	"net/http"
)

var lg log.Logger

func main() {
	config := ReadConfig()
	lg = getLogger(config)
	w := lg.Writer()
	defer w.Close()
	sensor := newSensor(config)
	collector := newCollector(sensor)
	lg.Debug("Registering the prometheus collector")
	prometheus.MustRegister(collector)
	http.Handle("/metrics", promhttp.HandlerFor(prometheus.DefaultGatherer, promhttp.HandlerOpts{
		ErrorLog: stdlibLog.New(w, "", 0),
	}))
	lg.Info(fmt.Sprintf("Starting http server on TCP/%d port", config.listenPort))
	lg.Fatal(http.ListenAndServe(fmt.Sprintf(":%d", config.listenPort), nil))
	daemon.SdNotify(false, daemon.SdNotifyReady)
}
Once started the binary shows the collected metrics on request :
$ pi@raspberrypi:~/go/src/github.com/guivin/dht-prometheus-exporter $ ./dht-exporter
time="2021-02-17T20:19:20Z" level=info msg="Initializing the DHT22/AM2302 sensor on the host"
time="2021-02-17T20:19:20Z" level=info msg="Starting http server on TCP/8080 port"
time="2021-02-17T20:19:36Z" level=info msg="Retrieved humidity=62.70%, temperature=68.90°F from the sensor"
The request is done on the TCP/8080 port :
# HELP dht_humidity_percent Humidity percent measured by the sensor
# TYPE dht_humidity_percent counter
dht_humidity_percent{dht_name="test",hostname="raspberrypi"} 62.8
# HELP dht_temperature_degree Temperature degree measured by the sensor
# TYPE dht_temperature_degree counter
dht_temperature_degree{dht_name="test",hostname="raspberrypi",unit="fahrenheit"} 68.9
# HELP go_gc_duration_seconds A summary of the GC invocation durations.
# TYPE go_gc_duration_seconds summary
go_gc_duration_seconds{quantile="0"} 0
go_gc_duration_seconds{quantile="0.25"} 0
go_gc_duration_seconds{quantile="0.5"} 0
go_gc_duration_seconds{quantile="0.75"} 0
go_gc_duration_seconds{quantile="1"} 0
go_gc_duration_seconds_sum 0
go_gc_duration_seconds_count 0
# HELP go_goroutines Number of goroutines that currently exist.
# TYPE go_goroutines gauge
go_goroutines 12
# HELP go_info Information about the Go environment.
# TYPE go_info gauge
go_info{version="go1.11.6"} 1
# HELP go_memstats_alloc_bytes Number of bytes allocated and still in use.
# TYPE go_memstats_alloc_bytes gauge
go_memstats_alloc_bytes 1.798512e+06
# HELP go_memstats_alloc_bytes_total Total number of bytes allocated, even if freed.
# TYPE go_memstats_alloc_bytes_total counter
go_memstats_alloc_bytes_total 1.798512e+06
# HELP go_memstats_buck_hash_sys_bytes Number of bytes used by the profiling bucket hash table.
# TYPE go_memstats_buck_hash_sys_bytes gauge
go_memstats_buck_hash_sys_bytes 724468
# HELP go_memstats_frees_total Total number of frees.
# TYPE go_memstats_frees_total counter
go_memstats_frees_total 1026
# HELP go_memstats_gc_cpu_fraction The fraction of this program's available CPU time used by the GC since the program started.
# TYPE go_memstats_gc_cpu_fraction gauge
go_memstats_gc_cpu_fraction 0
# HELP go_memstats_gc_sys_bytes Number of bytes used for garbage collection system metadata.
# TYPE go_memstats_gc_sys_bytes gauge
go_memstats_gc_sys_bytes 334848
# HELP go_memstats_heap_alloc_bytes Number of heap bytes allocated and still in use.
# TYPE go_memstats_heap_alloc_bytes gauge
go_memstats_heap_alloc_bytes 1.798512e+06
# HELP go_memstats_heap_idle_bytes Number of heap bytes waiting to be used.
# TYPE go_memstats_heap_idle_bytes gauge
go_memstats_heap_idle_bytes 589824
# HELP go_memstats_heap_inuse_bytes Number of heap bytes that are in use.
# TYPE go_memstats_heap_inuse_bytes gauge
go_memstats_heap_inuse_bytes 3.11296e+06
# HELP go_memstats_heap_objects Number of allocated objects.
# TYPE go_memstats_heap_objects gauge
go_memstats_heap_objects 6257
# HELP go_memstats_heap_released_bytes Number of heap bytes released to OS.
# TYPE go_memstats_heap_released_bytes gauge
go_memstats_heap_released_bytes 0
# HELP go_memstats_heap_sys_bytes Number of heap bytes obtained from system.
# TYPE go_memstats_heap_sys_bytes gauge
go_memstats_heap_sys_bytes 3.702784e+06
# HELP go_memstats_last_gc_time_seconds Number of seconds since 1970 of last garbage collection.
# TYPE go_memstats_last_gc_time_seconds gauge
go_memstats_last_gc_time_seconds 0
# HELP go_memstats_lookups_total Total number of pointer lookups.
# TYPE go_memstats_lookups_total counter
go_memstats_lookups_total 0
# HELP go_memstats_mallocs_total Total number of mallocs.
# TYPE go_memstats_mallocs_total counter
go_memstats_mallocs_total 7283
# HELP go_memstats_mcache_inuse_bytes Number of bytes in use by mcache structures.
# TYPE go_memstats_mcache_inuse_bytes gauge
go_memstats_mcache_inuse_bytes 3456
# HELP go_memstats_mcache_sys_bytes Number of bytes used for mcache structures obtained from system.
# TYPE go_memstats_mcache_sys_bytes gauge
go_memstats_mcache_sys_bytes 16384
# HELP go_memstats_mspan_inuse_bytes Number of bytes in use by mspan structures.
# TYPE go_memstats_mspan_inuse_bytes gauge
go_memstats_mspan_inuse_bytes 22080
# HELP go_memstats_mspan_sys_bytes Number of bytes used for mspan structures obtained from system.
# TYPE go_memstats_mspan_sys_bytes gauge
go_memstats_mspan_sys_bytes 32768
# HELP go_memstats_next_gc_bytes Number of heap bytes when next garbage collection will take place.
# TYPE go_memstats_next_gc_bytes gauge
go_memstats_next_gc_bytes 4.473924e+06
# HELP go_memstats_other_sys_bytes Number of bytes used for other system allocations.
# TYPE go_memstats_other_sys_bytes gauge
go_memstats_other_sys_bytes 1.315464e+06
# HELP go_memstats_stack_inuse_bytes Number of bytes in use by the stack allocator.
# TYPE go_memstats_stack_inuse_bytes gauge
go_memstats_stack_inuse_bytes 491520
# HELP go_memstats_stack_sys_bytes Number of bytes obtained from system for stack allocator.
# TYPE go_memstats_stack_sys_bytes gauge
go_memstats_stack_sys_bytes 491520
# HELP go_memstats_sys_bytes Number of bytes obtained from system.
# TYPE go_memstats_sys_bytes gauge
go_memstats_sys_bytes 6.618236e+06
# HELP go_threads Number of OS threads created.
# TYPE go_threads gauge
go_threads 9
# HELP process_cpu_seconds_total Total user and system CPU time spent in seconds.
# TYPE process_cpu_seconds_total counter
process_cpu_seconds_total 0.16
# HELP process_max_fds Maximum number of open file descriptors.
# TYPE process_max_fds gauge
process_max_fds 1024
# HELP process_open_fds Number of open file descriptors.
# TYPE process_open_fds gauge
process_open_fds 101
# HELP process_resident_memory_bytes Resident memory size in bytes.
# TYPE process_resident_memory_bytes gauge
process_resident_memory_bytes 1.0858496e+07
# HELP process_start_time_seconds Start time of the process since unix epoch in seconds.
# TYPE process_start_time_seconds gauge
process_start_time_seconds 1.61359321311e+09
# HELP process_virtual_memory_bytes Virtual memory size in bytes.
# TYPE process_virtual_memory_bytes gauge
process_virtual_memory_bytes 8.93046784e+08
# HELP process_virtual_memory_max_bytes Maximum amount of virtual memory available in bytes.
# TYPE process_virtual_memory_max_bytes gauge
process_virtual_memory_max_bytes 1.8446744073709552e+19
Deploy the Prometheus Exporter on the Raspberry
Install golang and `make to build the source code:
sudo apt install golang make
Defines your environment variables for Golang:
export GOPATH=$HOME/go
export GOBIN=$GOPATH/bin
export PATH=$PATH:$GOBIN
Download dep package:
go get -u github.com/golang/dep/cmd/dep
Clone the git repository and build the sources:
go get -u github.com/guivin/dht-prometheus-exporter.git
cd $GOPATH/src/guivin/dht-prometheus-exporter
git checkout tags/v0.1
make all
Install the systemd service unit:
sudo cp dht-prometheus-exporter.service /etc/systemd/system
Deploy the configuration file:
sudo cp dht-prometheus-exporter.yml /etc
sudo chown dht-prometheus-exporter:dht-prometheus-exporter /etc/dht-prometheus-exporter.yml
sudo chmod 0640 /etc/dht-prometheus-exporter.yml
Create a dht-prometheus-exporter system user and group for the exporter. This system user belongs also to the gpio as a secondary group to read gpio pins:
sudo useradd --user-group --groups gpio --no-create-home --system --shell /usr/sbin/nologin dht-prometheus-exporter
Start the systemd unit:
sudo systemctl daemon-reload
sudo systemctl start dht-prometheus-exporter
Check the logs of the systemd unit:
$ sudo journalctl -u dht-prometheus-exporter -f
Feb 18 07:14:25 raspberrypi dht-prometheus-exporter[4031]: time="2021-02-18T07:14:25Z" level=info msg="Initializing the DHT22/AM2302 sensor on the host"
Feb 18 07:14:25 raspberrypi dht-prometheus-exporter[4031]: time="2021-02-18T07:14:25Z" level=info msg="Starting http server on TCP/8080 port"
Register the Exporter in Prometheus
Create the prometheus system user and group:
useradd --home-dir /opt/prometheus --user-group --shell /usr/sbin/nologin --system prometheus
Download prometheus binary and adapt following your Raspberry Pi architecture (here we use armv7):
cd /tmp
wget https://github.com/prometheus/prometheus/releases/download/v2.25.0/prometheus-2.25.0.linux-armv7.tar.gz
tar xzf prometheus-2.25.0.linux-armv7.tar.gz
Create the home directory for prometheus user in /opt/prometheus:
sudo cp -r prometheus-2.25.0.linux-armv7 /opt/prometheus
sudo chown prometheus:prometheus /opt/prometheus
sudo chmod 0740 -R /opt/prometheus
Create /var/lib/prometheus directory with good permissions for tsdb (time-series database) storage:
sudo mkdir /var/lib/prometheus
sudo chown -R prometheus:prometheus /var/lib/prometheus
sudo chmod -R 0740 /var/lib/prometheus
Create a symbolic link from the configuration presents in /opt/prometheus to /etc
sudo ln -s /opt/prometheus/prometheus.yml /etc/prometheus.yml
Update the /etc/prometheus.yml and add a new job in scrape_configs block:
- job_name: 'dht-prometheus-exporter'
  static_configs:
    - targets: ['localhost:8080']
Create a systemd unit for prometheus in /etc/systemd/system/prometheus.service as follows:
[Service]
Type=simple
User=prometheus
Group=prometheus
ExecReload=/bin/kill -HUP $MAINPID
ExecStart=/opt/prometheus/prometheus \
  --config.file=/etc/prometheus/prometheus.yml \
  --storage.tsdb.path=/var/lib/prometheus \
  --storage.tsdb.retention.time=30d \
  --storage.tsdb.retention.size=0 \
  --web.console.libraries=/opt/prometheus/console_libraries \
  --web.console.templates=/opt/prometheus/consoles \
  --web.listen-address=0.0.0.0:9090 \
  --web.external-url=
SyslogIdentifier=prometheus
Restart=always

[Install]
WantedBy=multi-user.target
Start and enable prometheus service:
sudo systemctl daemon-reload
sudo systemctl start prometheus
sudo systemctl enable prometheus
Ensure prometheus is ok:
sudo systemctl status prometheus --no-pager
Note your Raspberry PI private IP using ip a command.
Open your browser and connect to it via TCP/8080 port with HTTP schema (e.g. http://<RASPBERRY_IP>:8080).
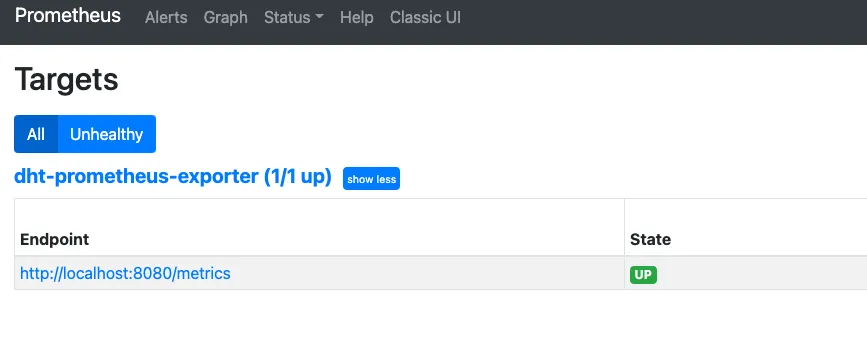
The exporter is well registered in the “Targets” menu:
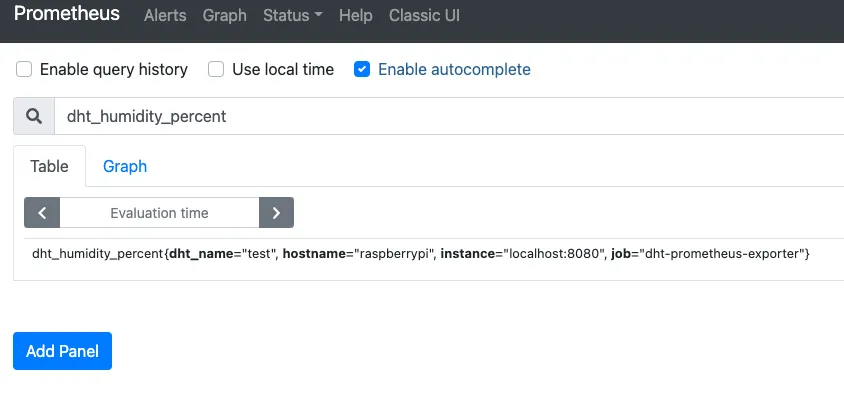
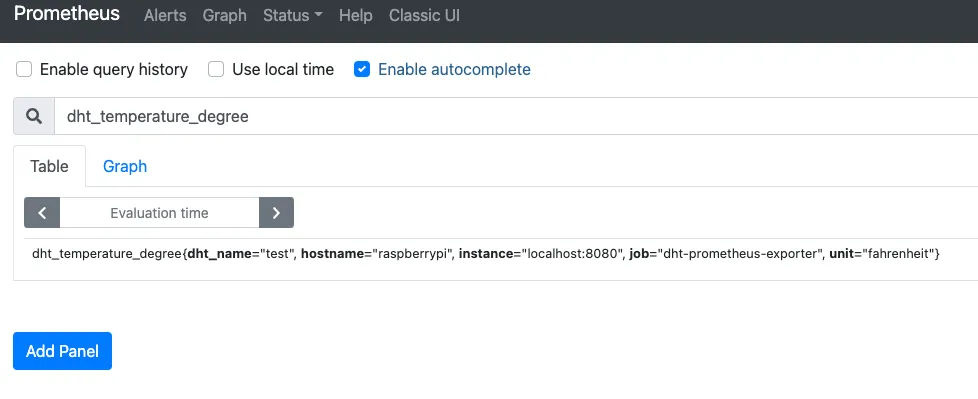
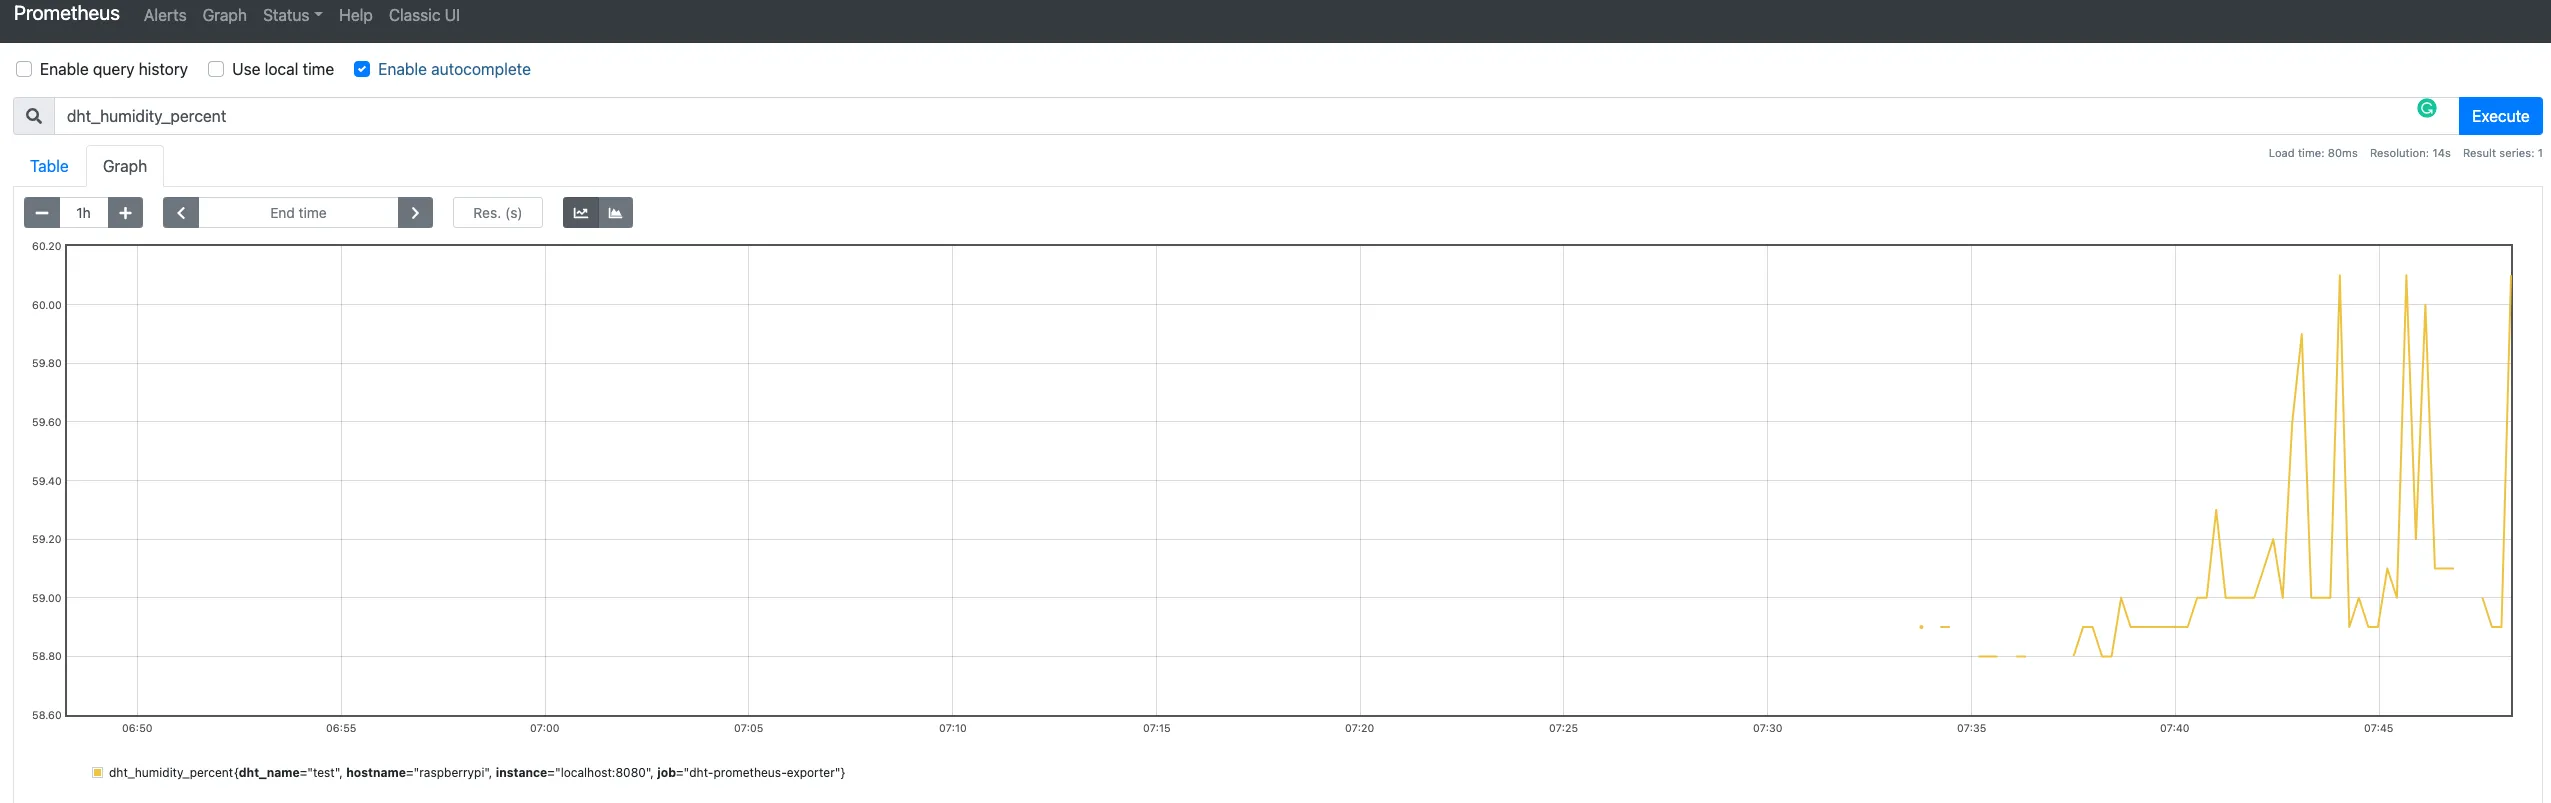
On the homepage of the Prometheus UI, we type the names of both metrics from the exporter. They are present and show their labels we have defined before:
We can also have a graph of the exporter metrics:
Grafana
Installation
For Grafana, you can follow instructions from this link : https://grafana.com/tutorials/install-grafana-on-raspberry-pi
Dashboard creation
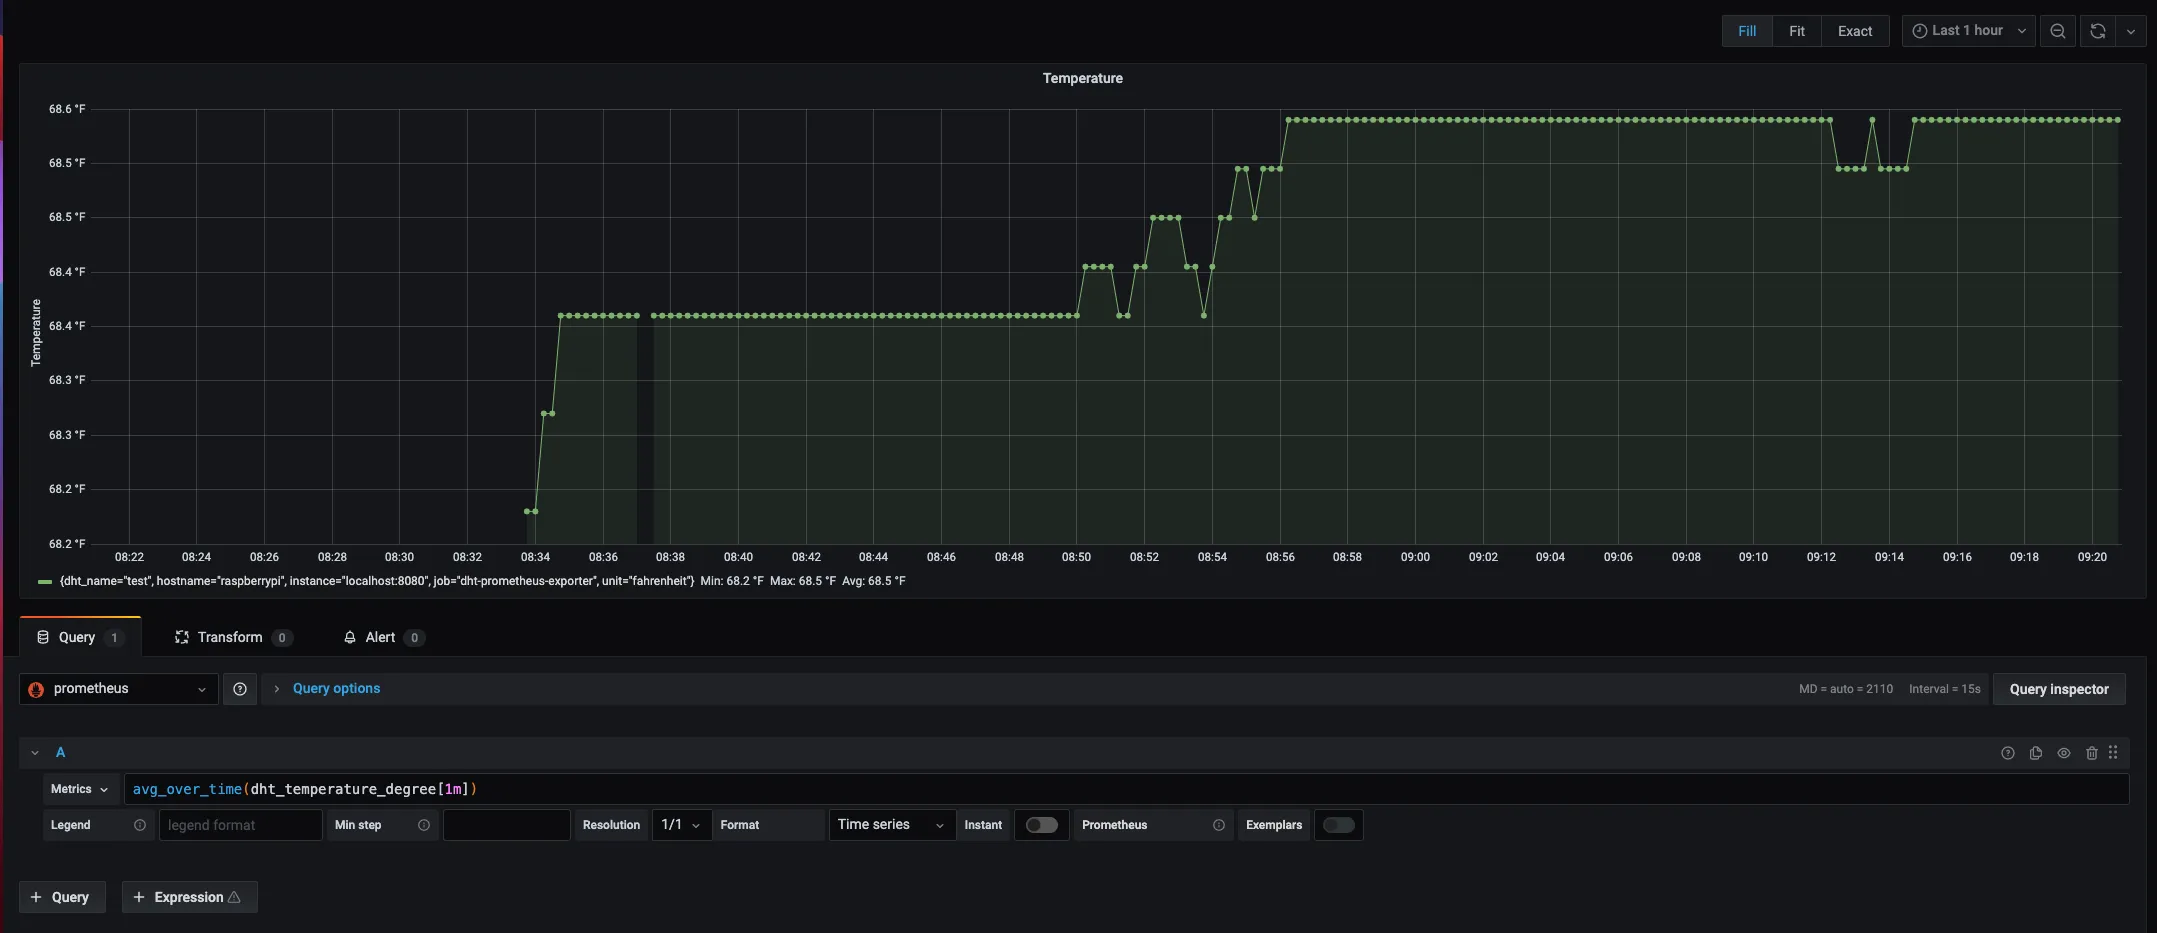
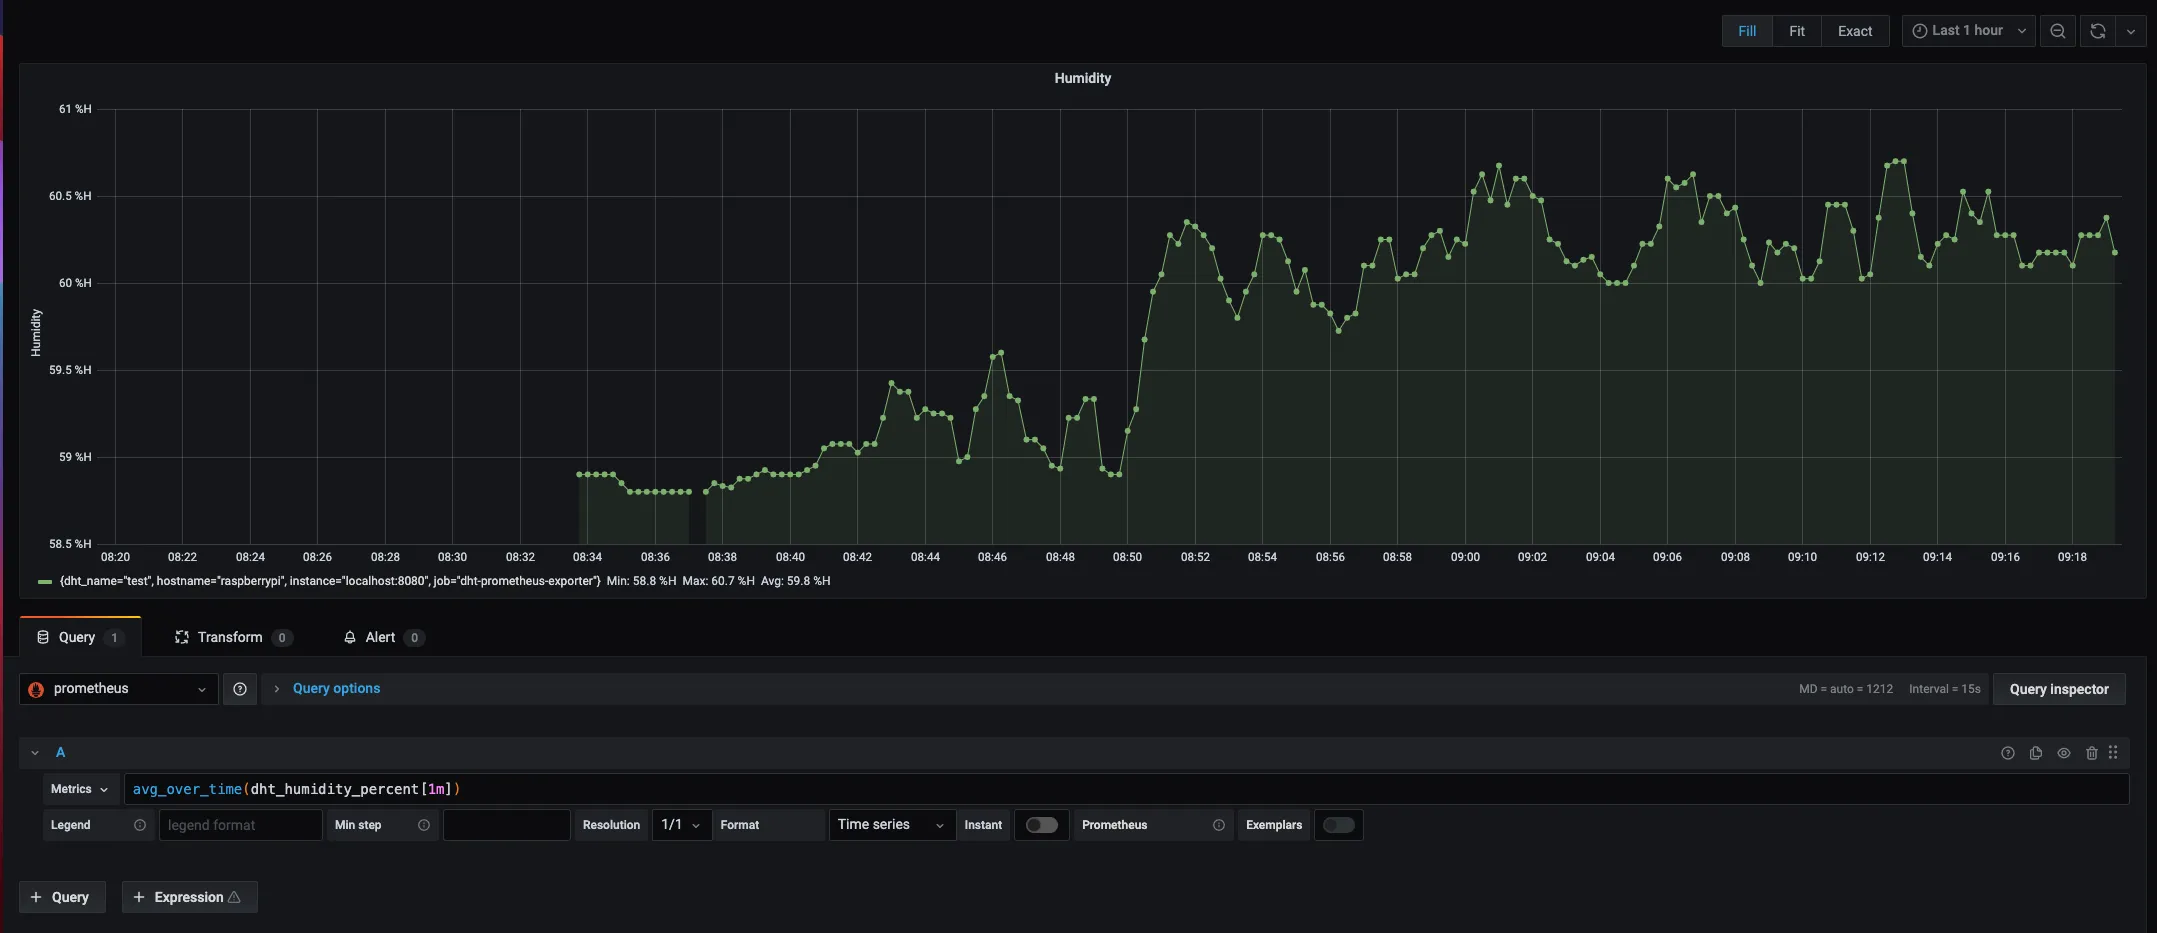
We access the Grafana interface and create a new dashboard. On this dashboard, we add a separate graph for each metric: temperature and humidity.
For both graphs, we use the PromQL avg_over_time function with a 1-minute range vector. This approach helps smooth the
data and prevents gaps or discontinuities in the graphs.
Conclusion
Through these steps, we’ve built a complete monitoring system using a sensor and a Raspberry Pi. We wired the sensor, validated data acquisition, and successfully measured room temperature and humidity.
To expose these metrics to Prometheus, we developed a custom exporter in Go that serves the data via an HTTP endpoint. We also added labels to our metrics, which is essential when tracking multiple sensors and distinguishing between them.
Next, we installed and configured Prometheus on the Raspberry Pi to scrape the exporter and store the metrics. Using Prometheus’s interface, we can query and analyze the data effectively.
While Prometheus provides basic visualization, we enhanced the experience by adding Grafana, creating a rich and interactive dashboard displaying temperature and humidity trends.
This project demonstrates what’s possible with a Raspberry Pi and Prometheus, offering an end-to-end pipeline for data collection, storage, and visualization.
I hope it inspires you for your next home automation or DIY monitoring projects.